New to investing in equities? Learn all about fundamental & technical analysis to make money
Fundamental analysis and technical analysis are the two major schools of thought when it comes to approaching the markets.
Stock analysis is a method for investors and traders to make intelligent buying and selling decisions. By studying and evaluating past and current data, investors and traders attempt to gain an edge in the markets by making informed decisions.
Fundamental analysis and technical analysis are the two major schools of thought when it comes to approaching the markets.
Fundamental Analysis
Fundamental Analysis is a holistic approach to study a business. When an investor wishes to invest in a business for the long term, it becomes extremely essential to understand the business from various perspectives.
It is critical for an investor to separate the daily short term noise in the stock prices and concentrate on the underlying business performance. Over the long term, the stock prices of a fundamentally strong company tend to appreciate, thereby creating wealth for its investors.
Technical Analysis
Technical analysis differs from fundamental analysis in that the stock's price and volume are the only inputs. The core assumption is that all known fundamentals are factored into the price; thus, there is no need to pay close attention to them.
Technical analysts do not attempt to measure a security’s intrinsic value, but rather, use charts and other tools to identify patterns that can be used as a basis for investment decisions.
The Underlying Basic Assumptions in Technical Analysis
1) The market discounts everything
This assumption tells us that, all known and unknown information in the public domain is reflected in the latest stock price. Technical analysts believe that everything from a company’s fundamentals to broad market factors to market psychology is already priced into the stock. The only thing remaining is the analysis of price movements, which technical analysts view as product of supply and demand for a particular stock in the market.
2) Price moves in trends
All major moves in the market are an outcome of a trend, spread over short term, midterm and long term. For example, the recent upward movement in the Nifty Index to 11,350 from 6,825 did not happen overnight. This move has happened in a phased manner, over the last 30 months. Another way to look at it is, once the trend is established, the price moves in the direction of the trend.
3) History tends to repeat itself
Technical analysts believe that history tends to repeat itself. This happens because the market participants consistently react to price movements in a remarkably similar way, each and every time the price moves in a certain direction. For example, in up trending markets, market participants get greedy and want to buy irrespective of the high price. Likewise in a down trend, market participants want to sell irrespective of the low and unattractive prices. This human reaction ensures that the price history repeats itself.
Chart 1- State Bank of India line chart drawn with technical analysis tools
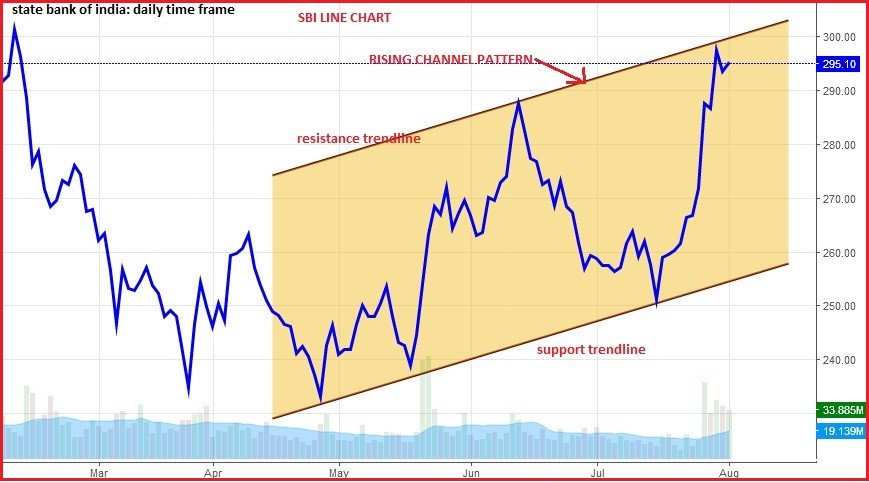
The chart depicted here is called ‘Line Chart’, as it is drawn by connecting only the closing prices of share price of SBI. It helps us to understand stock movement on day to day basis in previous years. The chart also shows a popular price pattern called Rising Channel shaded in light yellow color in SBI and it is taking support from Support trend line and resistance from upper trend line of the price pattern. One can understand trader’s psychology looking at volumes too which is shown at the bottom of chart. Nevertheless chart explains that SBI is in uptrend, and it will trade in a range of 260-300 where traders can apply ‘Buy on Dip’ strategy.
Important tools in Technical Analysis
1) Charts (Candlestick, line, Bar chart etc.)
2) Trendline
3) Oscillators (RSI/Stochastic/MACD etc.)
4) Indicators
5) Price Patterns (Head and shoulder, Channel, Wedge, Flag pattern etc.)
6) Moving Average (200 DMA etc.)
There are many different forms of technical analysis: Some rely on chart patterns, others use technical indicators and oscillators, and most use a combination of techniques. In any case, technical analysts’ exclusive use of historical price and volume data is what separates them from their fundamental counterparts as indicated above.
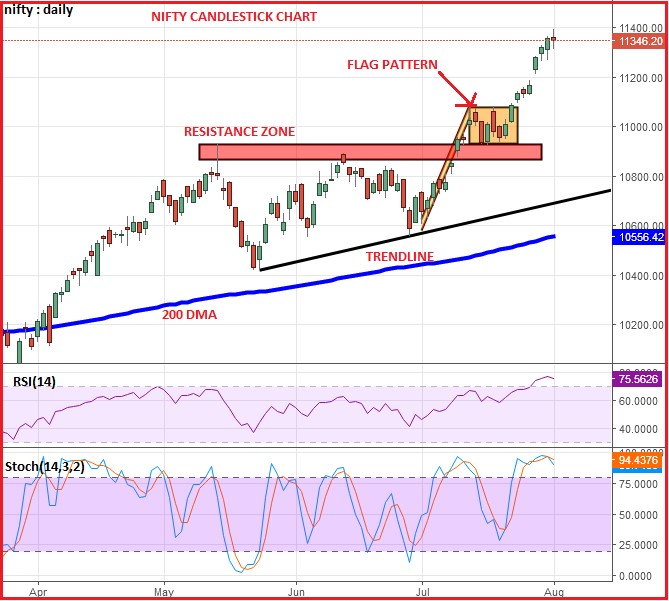
Majority of tools mentioned are indicated inside below Nifty daily candlestick chart.
Chart 2: Nifty candlestick chart with associated trend line, flag pattern, 200 dma, RSI and Stochastic
Application of Technical Analysis
Over the years, analysts have developed numerous technical indicators to help forecast future price movements. Some indicators are focused primarily on identifying the current market trend, including support and resistance areas, while others are focused on determining the strength of a trend and the likelihood of its continuation.
Technical analysts apply technical indicators to charts of various timeframes. Short-term traders may use charts ranging from one-minute timeframes to hourly or four-hour timeframes, while traders analyzing longer-term price movement scrutinize daily, weekly or monthly charts.
Asset Types
Probably one of the most versatile features of technical analysis is the fact you can apply TA on any asset class as long as the asset type has historical time series data e.g. Equities, commodities, foreign exchange, fixed income etc. This is also probably the biggest advantages of technical analyis when compared to the other fields of study.
To sum up we can say that technical analysis is a method of evaluating securities that involve a statistical analysis of market activity, such as price and volume. The most popular forms of technical analysis tools are simple moving averages, support and resistance, trend lines and momentum-based indicators. Technical analysis can be used on various asset classes including equities, commodities, currencies, and bonds.
Fundamental analysis and technical analysis are the two major schools of thought when it comes to approaching the markets.
Stock analysis is a method for investors and traders to make intelligent buying and selling decisions. By studying and evaluating past and current data, investors and traders attempt to gain an edge in the markets by making informed decisions.
Fundamental analysis and technical analysis are the two major schools of thought when it comes to approaching the markets.
Fundamental Analysis
Fundamental Analysis is a holistic approach to study a business. When an investor wishes to invest in a business for the long term, it becomes extremely essential to understand the business from various perspectives.
It is critical for an investor to separate the daily short term noise in the stock prices and concentrate on the underlying business performance. Over the long term, the stock prices of a fundamentally strong company tend to appreciate, thereby creating wealth for its investors.
Technical Analysis
Technical analysis differs from fundamental analysis in that the stock's price and volume are the only inputs. The core assumption is that all known fundamentals are factored into the price; thus, there is no need to pay close attention to them.
Technical analysts do not attempt to measure a security’s intrinsic value, but rather, use charts and other tools to identify patterns that can be used as a basis for investment decisions.
The Underlying Basic Assumptions in Technical Analysis
1) The market discounts everything
This assumption tells us that, all known and unknown information in the public domain is reflected in the latest stock price. Technical analysts believe that everything from a company’s fundamentals to broad market factors to market psychology is already priced into the stock. The only thing remaining is the analysis of price movements, which technical analysts view as product of supply and demand for a particular stock in the market.
2) Price moves in trends
All major moves in the market are an outcome of a trend, spread over short term, midterm and long term. For example, the recent upward movement in the Nifty Index to 11,350 from 6,825 did not happen overnight. This move has happened in a phased manner, over the last 30 months. Another way to look at it is, once the trend is established, the price moves in the direction of the trend.
3) History tends to repeat itself
Technical analysts believe that history tends to repeat itself. This happens because the market participants consistently react to price movements in a remarkably similar way, each and every time the price moves in a certain direction. For example, in up trending markets, market participants get greedy and want to buy irrespective of the high price. Likewise in a down trend, market participants want to sell irrespective of the low and unattractive prices. This human reaction ensures that the price history repeats itself.
Chart 1- State Bank of India line chart drawn with technical analysis tools
The chart depicted here is called ‘Line Chart’, as it is drawn by connecting only the closing prices of share price of SBI. It helps us to understand stock movement on day to day basis in previous years. The chart also shows a popular price pattern called Rising Channel shaded in light yellow color in SBI and it is taking support from Support trend line and resistance from upper trend line of the price pattern. One can understand trader’s psychology looking at volumes too which is shown at the bottom of chart. Nevertheless chart explains that SBI is in uptrend, and it will trade in a range of 260-300 where traders can apply ‘Buy on Dip’ strategy.
Important tools in Technical Analysis
1) Charts (Candlestick, line, Bar chart etc.)
2) Trendline
3) Oscillators (RSI/Stochastic/MACD etc.)
4) Indicators
5) Price Patterns (Head and shoulder, Channel, Wedge, Flag pattern etc.)
6) Moving Average (200 DMA etc.)
There are many different forms of technical analysis: Some rely on chart patterns, others use technical indicators and oscillators, and most use a combination of techniques. In any case, technical analysts’ exclusive use of historical price and volume data is what separates them from their fundamental counterparts as indicated above.
Majority of tools mentioned are indicated inside below Nifty daily candlestick chart.
Chart 2: Nifty candlestick chart with associated trend line, flag pattern, 200 dma, RSI and Stochastic
Application of Technical Analysis
Over the years, analysts have developed numerous technical indicators to help forecast future price movements. Some indicators are focused primarily on identifying the current market trend, including support and resistance areas, while others are focused on determining the strength of a trend and the likelihood of its continuation.
Technical analysts apply technical indicators to charts of various timeframes. Short-term traders may use charts ranging from one-minute timeframes to hourly or four-hour timeframes, while traders analyzing longer-term price movement scrutinize daily, weekly or monthly charts.
Asset Types
Probably one of the most versatile features of technical analysis is the fact you can apply TA on any asset class as long as the asset type has historical time series data e.g. Equities, commodities, foreign exchange, fixed income etc. This is also probably the biggest advantages of technical analyis when compared to the other fields of study.
To sum up we can say that technical analysis is a method of evaluating securities that involve a statistical analysis of market activity, such as price and volume. The most popular forms of technical analysis tools are simple moving averages, support and resistance, trend lines and momentum-based indicators. Technical analysis can be used on various asset classes including equities, commodities, currencies, and bonds.
Happy Investing
Source:Moneycontrol.com
No comments:
Post a Comment